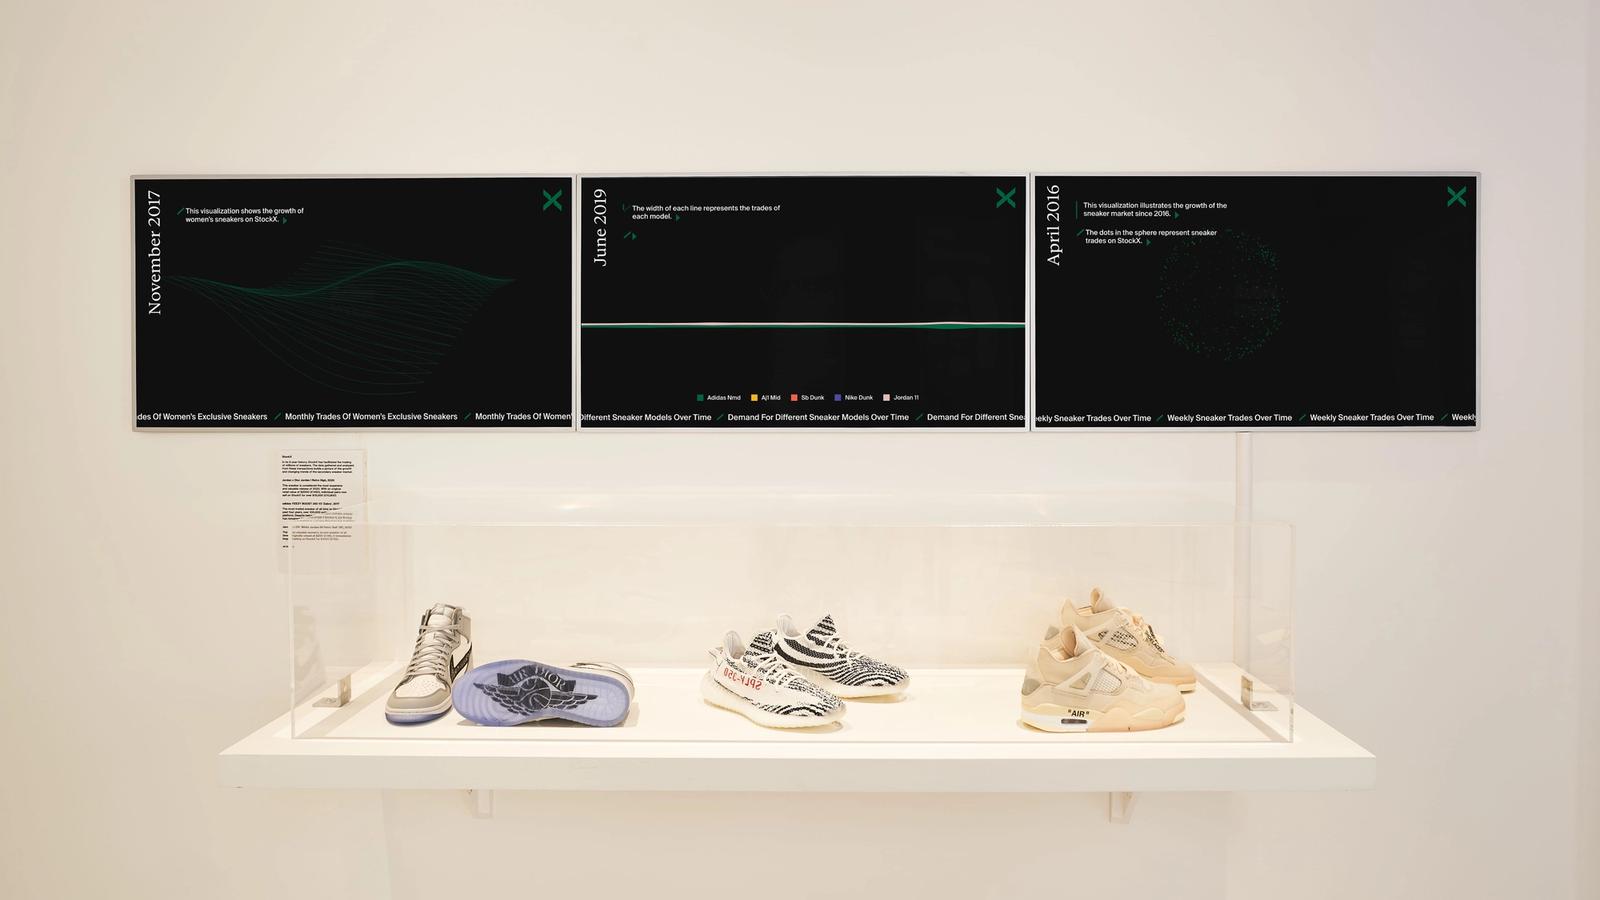
StockX x The Design Museum
Data Visualisation
Phygital / JavaScript / Data Viz / Vue.js / WebGL
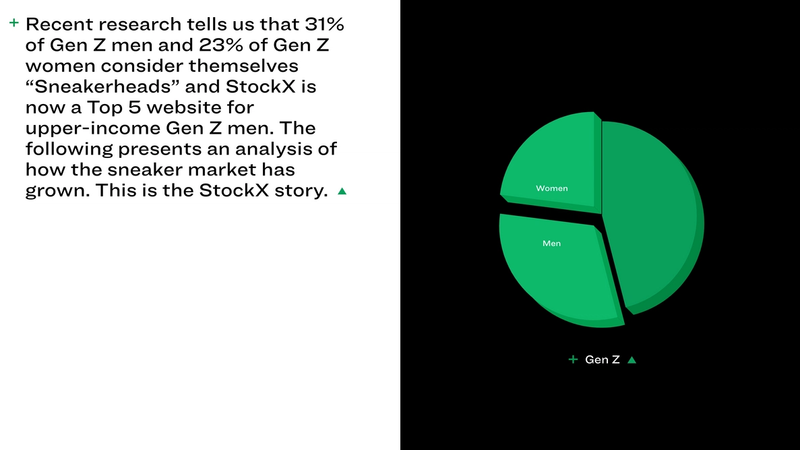
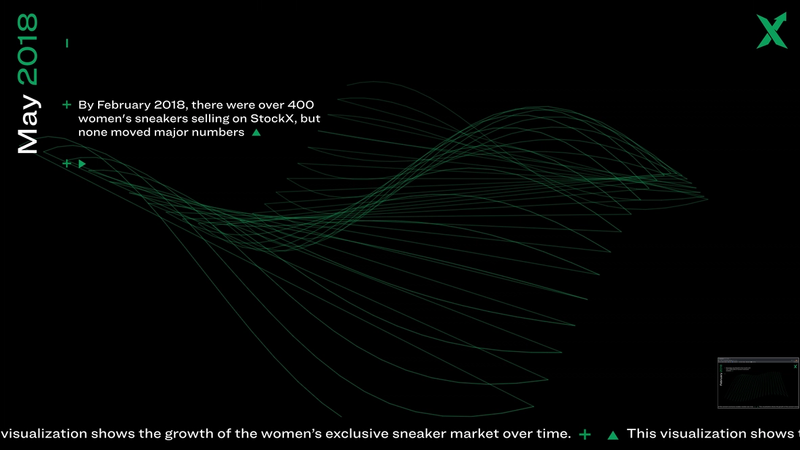
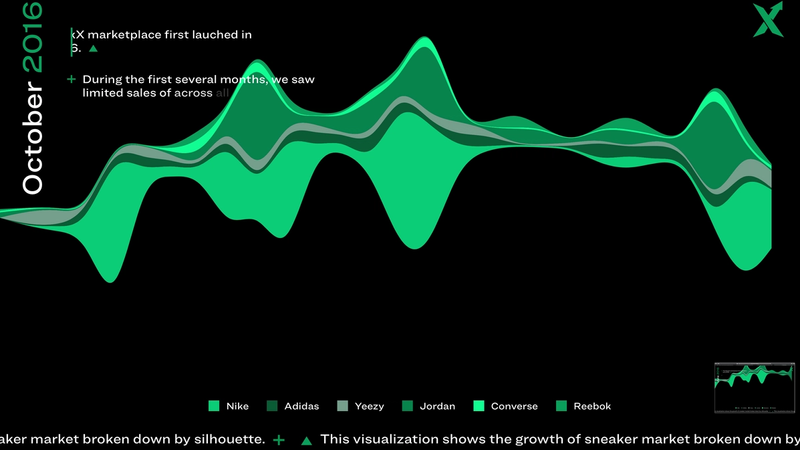
StockX wanted a digital visualisation base on sales and other business data they can show in an interesting way for museums and at events. I was tasked with building the visualisation based on designs, which could be modified with different parts of the data. We ended up with three main visualisations that could be changed and annotated. There was also data in the introduction and lots of 3D Animations to make it more of a slideshow based visual.
To help me achieve this I used web-based technologies such as JavaScript and WebGL. I used a component-based methodology so that we could break up different animations and use them separately if needed. I also created a backend using Sanity.io so the client could update content and upload data (via CSV) when needed.
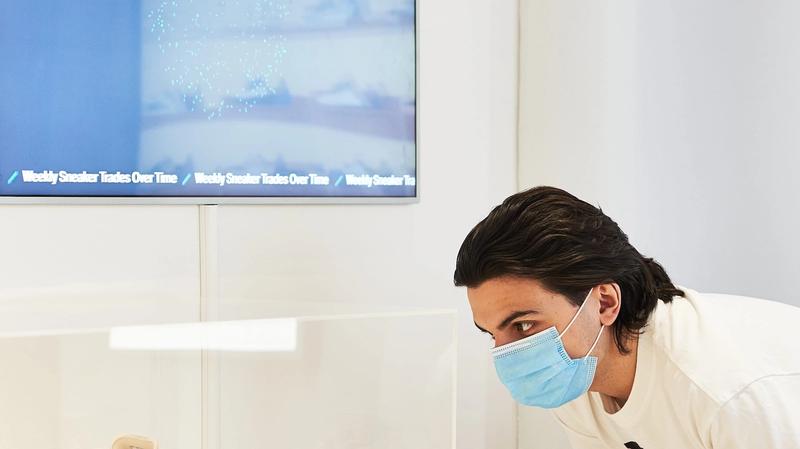
The first run of the visualisation was in the Design Museum London and since has been used in multiple places.

Credits / For: RLD
Design: Rosie Lee Creative